Affichage des articles dont le libellé est customer. Afficher tous les articles

lundi 6 juillet 2015

New survey says Samsung has more customer loyalty than Apple


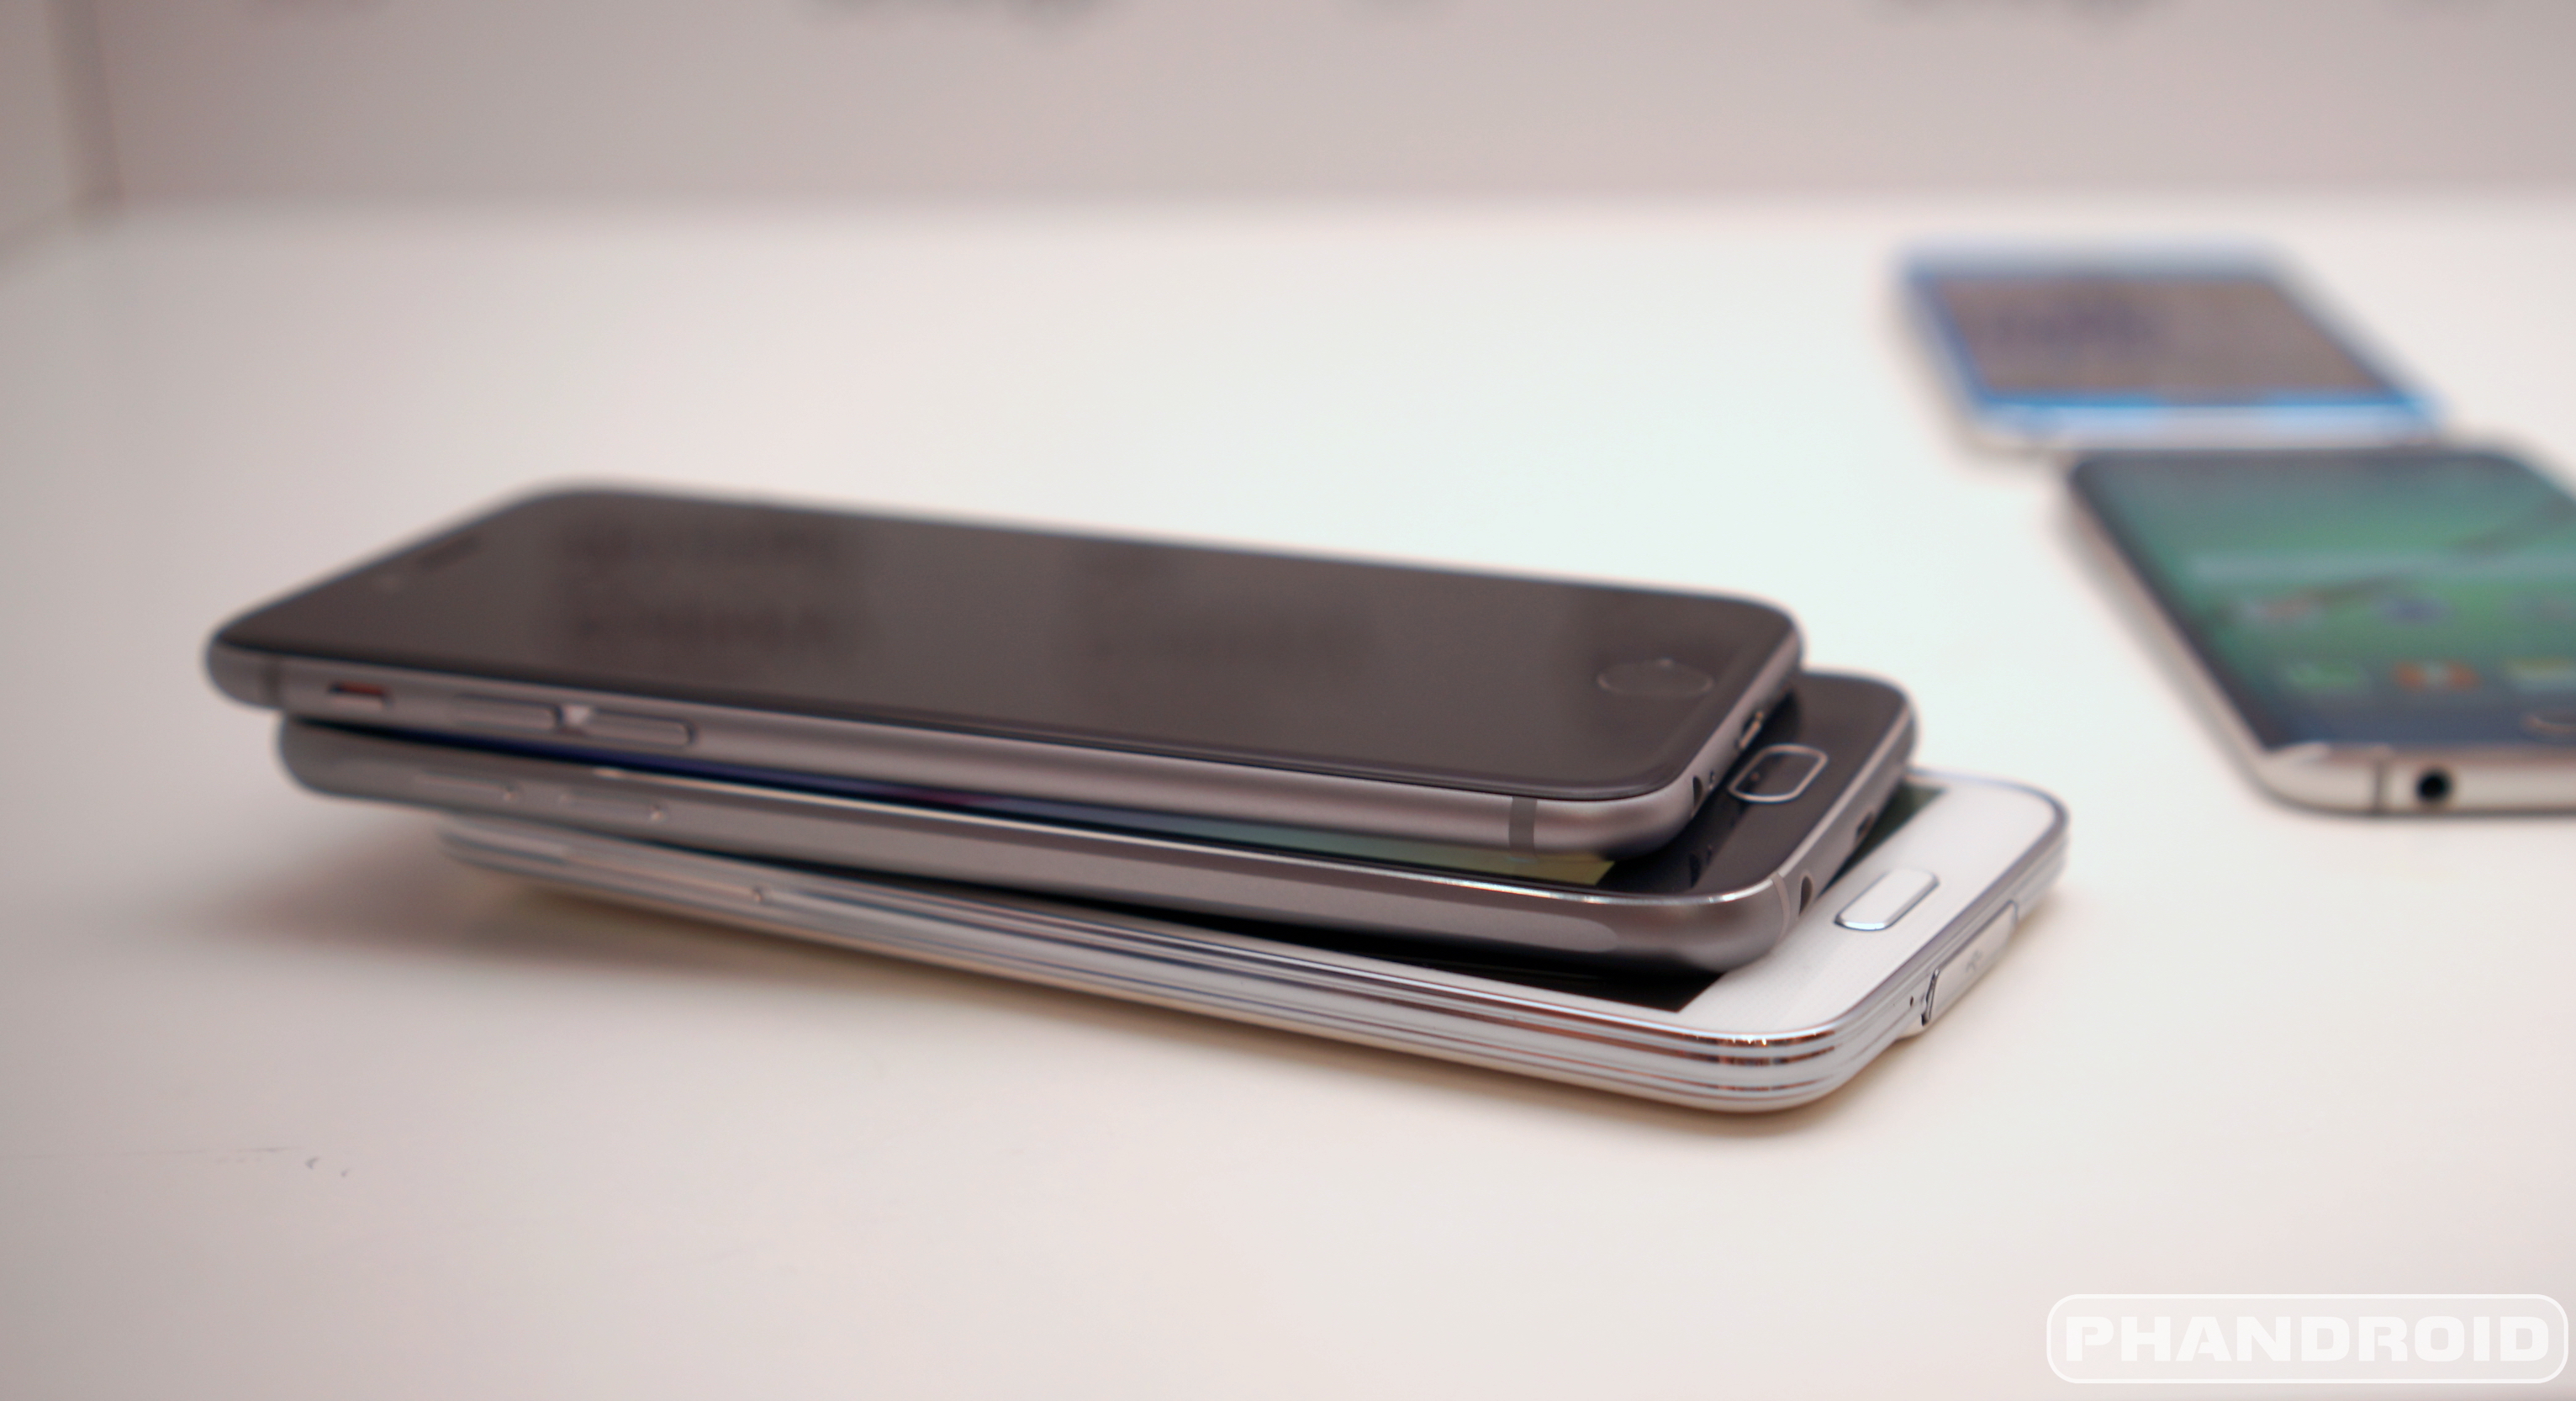
Samsung Galaxy S6 S5 iPhone 6 DSC08563


Customer loyalty is an under-appreciated statistic. The way a company treats its existing customers can make a big difference when it’s time for those customers to buy new devices. Treat them well and they will stick with you, treat them poorly and they’ll ditch you. Apple is always considered to have very high customer loyalty, but a new survey may have proved differently.


SurveyMonkey is a company that tries to define where a brand stands with users. They conducted a survey to gauge customer loyalty from industry leaders. Samsung scored a 35 while Apple scored a 28. Both scores are well above the industry average. Microsoft scored -8 (yeesh). Customer loyalty doesn’t tell the whole story, though.


Customer service satisfaction showed different results. Apple scored 41% satisfaction whereas Samsung was just 25%. These numbers don’t look good for either company. Less than half of your customers being satisfied is not a good thing, especially when the industry benchmark is 75%. Are you satisfied by your Samsung or Apple product? Would you say you’re loyal to either brand?


survey-monkey-nps-csat-02


[via CNET]


T-Mobile’s next-gen coverage maps pull data from real-time customer usage


SEA_Map


T-Mobile’s strange-looking coverage maps used to be the inside joke of the wireless industry, but the company has made significant strides to improve their network in the past couple of years. With LTE, much-improved coverage, a forward-looking approach to network design and overall better network stability they’ve set themselves up for a nice future, and now they’re looking to flaunt it with their “next generation” coverage map.


The map uses crowd-sourced real-time data points to give users a clear — and, more importantly, accurate — idea of how strong T-Mobile’s network is in their area. They also use public speed test results to show you an average of the types of data speed users experience in any given area. Here’s the full breakdown of what their new coverage map brings:


  • Customer-verified coverage based on actual customer usage, resulting in a vastly more transparent and accurate map, showing, for example, exactly where you can expect 4G LTE, 4G, 3G or other levels of coverage.

  • A Verified Coverage icon indicating where the majority of data is provided by T-Mobile customers reporting their actual network experience, providing an added layer of confidence.

  • Data that’s updated twice monthly − compared to data presented on the carriers’ maps, which is already dated by the time it’s printed and published and may be months or even years old.

  • Speed test data from trusted third party apps showing average download speeds from customer speed tests over the last 90 days.


It’s nothing other apps haven’t been trying to do for years to help customers make informed decisions about finding the right carrier for them. Carrier Coverage is one app that looks to fill that need. But this is the first time a carrier has taken it upon themselves to create a coverage map based on crowd-sourced data and provide more than just pretty colors on a meaningless map. We’d love to see the other big 3 follow suit. You can check it out for your area right now by heading to T-Mobile’s coverage website here.


[via T-Mobile]